
Meta Description: Learn all about sealing surfaces, surface texture and the surface finish charts used in manufacturing and measurement standards, Ra values, and application with real life use of surface finish charts so as to deliver the best product quality and performance.
Surface finish charts can be used as one of the most vital references in contemporary manufacture that offers crucial information on how manufacturers can arrive at ideal product quality, functionality, and performance, including surface roughness values . The knowledge of these charts will empower the manufacturer, engineer and quality control experts to articulate proper finishes on the surface and be within the functional and cost practical requirements. This entails an in-depth tutorial covering all that there is to know about the surface finish charts ranging right up through intricate details in numerous industries.
Understanding Surface Finish Fundamentals
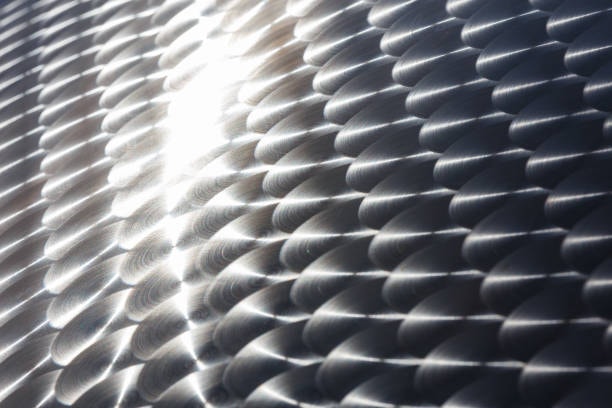
Surface finish is an expression used to describe the texture properties of a manufactured surface, and is quantified in a number of parameters that measure surface irregularities. Ra (Roughness Average) is most commonly used parameter and corresponds to an arithmetic mean of absolute values of heights that deviate the mean line of a surface as well as the vertical distance between peaks and valleys . Surface roughness plots are capable of indicating various forms of surface finish having Ra roughness options of 12.5 and having values up to 0.4 m Ra (very rough to very smooth), therefore, offering manufacturers standard templates to use in reference to specifying the quality of surface requirements.
Finishes The finished state of a surface has a direct influence on the performance of products: friction, wear resistance, corrosion protection, looks. In most cases parts that require tight dimensional tolerances are better finished smooth whereas those parts that require enhanced grip or better adhesion may need controlled roughness. The knowledge of such relationships can assist the manufacturers in optimizing the surface finish specification towards the desired visual appearance an surface finish for specific applications in terms of multiplication of the performance demanded by the application and the cost of production.
Key Surface Roughness Parameters and Measurements
Surface finish charts have several parameter measurements of the type beyond Ra values and characterize a complete surface. Rz is the average maximum height of roughness profile that calculates the average vertical extent between the tallest, peaks and the lowest, valleys, over sample lengths defined by the evaluation length . Rt denotes total height of roughness profile, which is the vertical interval between the absolute maximum peak and valley over the whole length of the evaluation.
Root Mean Square (RMS) roughness gives yet another important measurement of root mean square average , upon which the standard deviation sum of surface heights over mean line is taken. This parameter has greater sensitivity of severely varied surface than Ra values. Center Line Average (CLA) is an earlier measurement standard that is still used in legacy documentation, basically the same measurements as Ra but notated in different units. Ra = Roughness, (Avg in micro-meters / in micro-inches), RMS = Root Mean Square in micro-inches, CLA = Center Line average in micro-inches which illustrates that you need to know different systems of measurement to apply in the different industries and regions.
Manufacturing Process Impact on Surface Finish

Various manufacturing processes intrinsically result in different property ranges of the surface finish properties thus selection of process is essential in determining the achievement of some surface quality desired. Depending on cutting constant and tool condition and materials, machining processes including turning, milling, and drilling usually generate surfaces whose Ra values are in the ranges of 0.8Ui to 6.3Ui, making measuring surface roughness critical for quality assurance . Normally, a finish described as ‘as machined’ is attributed a roughness average (Ra) of 3.2; but the part has visible lines made by the cutting tool, highlighting the characteristic directional patterns created by conventional machining processes.
Surface roughness of grinding turns out to be much smoother with Ra values generally within the range of 0.1 to 1.6 micrometers so it can be applied to precision work associated with dimensional tolerance and surface finish. The casting processes tend to produce more rough surface with Ra values varying between 6.3 to 25 micrometers, which affects the overall surface profile and in cases where finer surfaces are required additional finishing processes might be employed. The surfaces finished by injection molding can be fairly smooth out of the mold depending on the quality of the mold surface and material processed with Ra of 32.0 or less being possible.
Standard Surface Finish Symbols and Notations
On engineering drawings and specifications, using standard symbols and notations on surface requirements, surface finish charts provide an effective form of communication. The simple symbol of surface finish is made up of a shape which formed a check mark with the extra details that point out to particular demands of Ra determination, the directions which are being measured and the finishing operation. Surface finish is specified as a modern drawing by the Ra symbol followed by the surface desired roughness in microns or microinches, which is crucial for surface measurements .

Advanced surface finish code has more parameters that comprise of waviness requirements, measuring sampling lengths, directional practices. The symbols system as well allows specifying more than one surface parameter with non contact methods at once so that the full definition of the surface quality is possible. Such knowledge will facilitate the correct interpretation of engineering drawings and avoid expensive mistakes in manufacturing as in mistakes it is not clear what should be the finish of a surface listed on an engineering drawing.
Industry-Specific Surface Finish Requirements
Each industry has its own surface finish criteria of functional, regulatory, and performance need as per the application. The manufacture of aerospace products requires extremely high smoothness between key parts as the specifications may require Ra thickness to be less than 0.8 micrometers in size on high stress or fatigue parts. The necessity of such strict requirements, including maintaining the highest peak measurements, is to perform optimally, reliably and safely in aerospace applications where the failure of such component might have disastrous implications.
The use of medical devices involves the manufacturing of surfaces that accommodate sterilization but at the same time they inhibit bacterial growth and contamination. Better surfaces to clean and sterilize. The outcome of the passivated surfaces is increase in the resistance against corrosion which is why it is so important that the surface finish of the medical application is correctly chosen. The requirement of food processing equipment is also that of a smooth surface that cannot accommodate bacterial growth but allows cleaning and sanitization services to be possible, often verified with a surface roughness comparator .
Automotive automotive surfaces must meet both the performance and cost needs: they define the surface treatments that are suitable to the part-to-be-manufactured, and must simultaneously ensure that surface treatments are cost effective to produce. When oil retention is needed on engine parts, controlled roughness patterns can be provided, and understanding the roughness depth is essential for decorative exterior parts (the only exposed surfaces visible to the outside world) that need to be smooth and apply uniform coating all over to look good and prevent corrosion.
Measurement Techniques and Equipment
A good surface finish measuring instrument and method must be applied depending on a particular type of measurement requirement and component nature. Contact stylus profilometers are the most popular type of measurement proving a diamond-tipped stylus that scans across the surface with recording vertical movement differences, allowing for the calculation of the arithmetic average of surface roughnes . The instruments offer a very accurate measurement of Ra, Rz and other parameters and can be used in most manufacturing processes.
Non-contact optical methods are advantageous to be used over the sensitive surfaces or parts that may not be able to endure the contact forces of the stylus. Non contact laser-based systems, white light interferometry and confocal microscopy can give detailed information on surface topography, including surface waviness, and are capable of measuring fragile or soft materials. The techniques also provide fast measurement properties that are well applicable in high production industries.
Hand-held measurement tools allow verifying the surface finish at the place of production, which can assist quality control operation directly on the factory floor. The instruments allow instant process R-calibration and quality control, facilitating the ensuring of the quality of the product’s surface finish of the manufacturing runs.
Surface Finish Chart Applications in Quality Control
Surface finish charts have become basic guidelines in developing quality control processes and acceptance rates within manufacturing plant establishments. These charts are used by quality control personnel to understand a given surface finish requirement and hence choose the method and instrumentation of measurement. The charts give a clue to setting up an inspection frequency as well as sampling protocols using process capability and the importance of a surface finish requirements.
Surface finish values are used in an application of statistical process control to observe the process stability and trend that may present the process of tool wear, machine degradation, or process parameter drift. Control charts measuring surface finish as a function of time allow on-going planning of maintenance activities and optimization of the process, monitoring deviations from the mean before quality problems affect the product performance.
The surface finish charts mentioned at incoming inspection procedures are used as reference to ascertain the components delivered by suppliers have satisfied the stipulated requirements. This check probably guarantees controlled quality of the supply chain and the avoidance of assemblage of roughness grade numbers goods that are of low quality that may in the future inhibit the performance of the finished product.
Cost Considerations and Optimization Strategies
The specification of the surface finish has a significant influence on the cost of manufacture with smooth finishes needing more processing and tightened process control. The correlation between the cost and square average surface finish requirements helps the engineers to understand the impact of different machine tools have the best specification that suits particular applications (with an optimal balance between cost and performance requirements).
Secondary finishing, e.g. a polishing polishing or grinding or chemical effects, adds both processing time and material costs as well as may necessitate special equipment and experienced personnel. Strategies of design optimization look at defining minimum surfaces, such as bead blasting, so that it requires the surface finish only in the places where the demand is necessitated by the work. This makes the surface finish coarser in other places to help bring costs down of manufacture while still considering the surface geometry of the design .
Value engineering methods consider cost-effective alternatives to manufacturing processes or design change that can perform the performance demanded but do not have the same surface finish requirements. These solutions may involve change of materials used, geometry, or having optimization of the process so that the surface finish may not be critical, as per the surface roughness chart but still the product functionality is not compromised.
Advanced Surface Characterization Methods
Surface finish analysis is not restricted to measuring Ra parameters anymore but has recent developments that are in three dimensions using the surface topography and functional surface parameters. Such techniques offer an improved insight to surface properties and its correlation to component performance which allows more specific optimization of surface finish that is typically measured .
Useful parameters given, include bearing ratio curves and the depth of core roughness, and reduced summit height all giving an idea of the nature of surface performance as pertains to a particular application. The parameters guide the prediction of tribological behavior, sealing effectiveness, and an adhesion property by in-depth surface topography analysis.
Multi-scale surface analysis allows surface properties to be discussed in term of a variety of length scales, from macro-geometric form to waviness and into micro-roughness. The integrated method allows fully characterizing the surface and optimizing surface finish requirements of complex applications that demand multifactor performance requirements.
Digital Integration and Industry 4.0 Applications
Industry 4.0 and digital quality management systems Digital quality management systems, as well as Industry 4.0 frameworks, increasingly include surface finish measurement and control in their modern manufacturing environments. The real time measurements of surface finish charts by automated measurement systems include immediate feedback on the surface finish to be used on the process control applications and quality assurance applications average roughness.
Digital surface finish charts and databases allow the quick access to the information of specifications and measurement data within the manufacturing organization. These systems can accommodate requirements of traceability and have available analytical abilities of processes that measure relative smoothness as a means of process optimization and continuous improvement programs surface roughness measurement.
ML Applications Machine learning technicians use the data collected in surface finish measurements to predict process performance, improve manufacturing settings, and detect possible problems with production quality before it became evident. Such high-level analytics features allow proactive quality control and improved efficiency of manufacturing desired surface finish cut off length.
Troubleshooting Common Surface Finish Issues
The actual surface finishes produced in the manufacturing processes sometimes do not meet the stipulated requirements and therefore systematic troubleshooting strategies are needed to formulate the root causes and then initiate the corrective actions peak to valley. Its typical problems are over-roughness, directional surface patterns, periodicity and surface quality inconsistency in production lots.
Tool wear is a common factor that occurs in case of machining where the finishing of the surface is likely to deteriorate with time in form of rising surface roughness. Timely replacements and inspection of the tools based on the monitoring of the surface finish also contribute to the constant quality and the optimization cost of tools utilization material removal.
Progress parameter optimization solves problems of surface finish associated with cutting speeds, feed rates, application of coolants and machine conditions. Measuring systematically adjusted parameters with respect to surface finishing results and adjusting these parameters gives the possibility to discover the best processing conditions in respect of surfaces, applications and materials center line avg.
Future Trends and Technological Developments
Surface finish technology is still advancing in terms of measuring and manufacturing methods, as well as materials science. Advent of new measurement technologies provide improved resolution and speed in measurements as well as analytical capabilities which allows more complex methods of characterization and control of surfaces key parameters.
The additive manufacturing processes offer surface finish challenges and opportunities that have not been previously available to the conventional manufacturing processes, and must undergo the development of new measurement procedures and finishing processes that could fit the complex geometric elements that additive manufacturing processes create employing 3D printing technologies average values. Areas in high tension or high RPM areas need particular surface dressing. The best finish used in these applications was 0. 4uM Ra which bears the best quality feature indicating that there is still a great need of the slick surface finishes in the high performance applications.
Surface finish Nanotechnology applications are increasingly requiring surface finishes to be controlled to nanometer scales, stimulating the evolution of ultrahigh precision manufacturing and measurement technologies. Such applications require higher surface finish specifications and test methods that can define surface characteristics on molecular scale.
Conclusion
The perfect understanding of the surface finish charts and their application helps one to achieve the mastery of surface finish management in the execution of the product manufacturing excellence based on the most efficacious surface finish specification and control. Comprehension of the correlation between surface finish forces, process, and component performance can help engineers and quality professionals prescribe suitable surface finishes that matches functional demands and is affordable. With the constant development of manufacturing technologies, surface finish charts will keep on being basic references that will serve quality, performance and efficiency in the contemporary manufacturing environment.